Category: Analytics

Lessons on data analytics from a tween
I recently received a note from my 11 year old son’s maths tutor, which read:
“Jack will be covering Data, specifically: collecting categorical and numerical data thru observations and surveys, Constructing data displays including dot plots, column graphs and line graphs, naming and labelling vertical and horizontal axes, Using scale to determine placement of each point when drawing a line graph.”
“Aha! Welcome to the world of Business Intelligence!” I thought with a smile. Excitedly, I introduced Jack to my veritable library of books on the subject of charting and data visualization, including of course, all my favourites such as “Signal: Understanding What Matters in a World of Noise” by Stephen Few, “The Wall Street Guide to Information Graphics (the do’s and don’ts of presenting data, facts and figures)”, “Data Points: Visualization That Means Something” and many others. With no words and a tweenage look of disdain, he resumed his game of Roblox (Minecraft was no longer “cool” since it’s acquisition by Microsoft, I was off-handedly informed…)
Then, almost in passing, Jack mused: “I wonder how the number of Roblox users by year would look in a line chart…?”
Challenge accepted. A quick Google search, drop the data into a self-service data visualization tool, and we had our answer.

What was quite interesting to me was that he was thinking in terms of the data, wanting to answer a question empirically, and wanting to see the data visually to interpret the results. Now, as I listen to my son in the background, collaborating in real-time with one of his school friends in multi-player Roblox while they chat and interact simultaneously through Facetime, it’s occurs to me that future generations of ‘knowledge worker’ are likely to be much more collaborative and team-oriented, much more visual and data savvy, much less inclined to accept decision-making which cannot be supported by data. Which, of course, reminds me of a classic Dilbert moment:

Couple the inquisitive, knowledge-hungry mindset of our younger generations with the relentless pace of change and innovation, and we can anticipate that our future business users will not be tolerant of poor decision-making or slow time to action caused by the outdated insights provided by traditional analytics infrastructures. Today more than ever, analytics is a key to business success, but it needs simplicity, real-time speed and security: how fast can a user access and blend all the disparate data they need, analyze and share it, then take action, all in a secure and controlled environment? How can we provide solutions which enrich data with context, to build consensus? How can we empowering teams with the right data, providing machine learning-driven insights and personalization? Cognitive, collaborative analytics helps teams take action in real-time, to work on the right things at the right time. Our future decision-makers will expect nothing less.
Footnote – 10 of my favourite books on Data Visualization and Presentation:
- Signal: Understanding What Matters in a World of Noise – Stephen Few
- Now You See It: Simple Visualization Techniques for Quantitative Analysis – Stephen Few
- Data Points: Visualization That Means Something – Nathan Yau
- Presentation Zen: Simple Ideas on Presentation Design and Delivery – Garr Reynolds
- The Wall Street Journal Guide to Information Graphics: The Dos and Don’ts of Presenting Data, Facts, and Figures – Dona M. Wong
- Design for Information: An Introduction to the Histories, Theories, and Best Practices Behind Effective Information Visualizations – Isabel Meirelles
- Visualize This: The FlowingData Guide to Design, Visualization, and Statistics – Nathan Yau
- The Visual Display of Quantitative Information – Edward R. Tufte
- Show Me the Numbers: Designing Tables and Graphs to Enlighten – Stephen Few
- Storytelling with Data: A Data Visualization Guide for Business Professionals – Cole Nussbaumer Knaflic

Collaborative Mainframing
(This post originally appeared on the Rocket Software Blog)
This week in San Jose, I attended my first SHARE conference, both as an attendee and as a speaker. Having grown up in the world of business intelligence and analytics, it was interesting to get an insight into the world of the mainframe – and to meet many of the world’s leading experts in this timeless platform. During my session (“Information at the Speed of Thought — How Social Business Solutions Power Collaborative Analytics”) we had active discussions around a couple of very interesting topics:
- The need for curation and governance in support of self-service business decision-making;
- Balancing the “need for speed” in accessing and collaborating around business information with the need for security and controls around the data.
In both cases, I found it interesting to learn that the mainframe is the perfect power tool to facilitate these needs. By providing an easy mechanism to connect directly to the underlying mainframe data, visualize it, and then share it appropriately, users (including just about every bank in the world) avoid the need for a costly, time-consuming “ETL” approach with all the inherent limitations that approach introduces, including timeliness of data, effective governance and lineage of the data, difficulty keeping pace with business users’ evolving information needs, and the like.
 One analogy, which seemed to resonate during my session, was the idea that finding a business insight and sharing it with colleagues should be as easy as “taking a picture and posting it on Facebook.” The increasing complexity of the world we all work in is making it imperative for us to work collaboratively to solve business problems. The old world of silos and “information hoarding” is not effective, and the information needed to support business decision-making needs to be quickly accessible, wherever it resides, as well the business need to have a good payroll systems that allow them be competitive, and sometimes the best way to reach this is by outsource program, but why you should outsource your payroll?
In this new world of #alternativefacts and #fakenews, it’s now more important than ever to be able to infuse business social networks with curated, governed data in support of informed, fact-based decision-making.

Putting the ‘business’ into ‘social’
Traditional BI ‘collaboration’ is one-to-many e.g. publishing infographics to a website or emailing a PDF – it’s like running a webinar where the participants are on mute (‘listen only mode’). The future of collaborative BI must evolve to ‘many-to-many’ – including abilities for co-authoring of BI content, as well as co-consumption, annotation, discussion, sharing, editing. The basis of innovation is being able to build upon the work of others, contributing to the ‘body of knowledge’. Collaborating, in other words.
Yet historically, too many people, particularly those involved in Governance of BI systems, have essentially been ‘anti-collaboration’. Which has, ironically, made the situation worse by encouraging users to find ‘work-arounds’, resulting in, for example, the proliferation of spreadsheets. As Boris Evelson of Forrester Research recently commented to me in an email on this topic, “We increasingly hear from our clients that BI silos are now proliferating. Basically these platforms are now becoming the new spreadsheets”
The combination of Enterprise Social platforms such as IBM Connections with more modern Cloud-ready, mobile enabled, self-service BI tools helps move better decision making into the line of business, moving towards an ability to see and manage outcomes in real time. Recent research from Aragon Research suggests that, by the end of 2017, 75% of business will be harnessing mobile collaboration, helping to provide real-time analytics for the team, and embrace agility in the workforce. Sometimes business owners become so much focussed on their growth that they fail to notice the significant amount of money being leaked through their outdated methods of recording employees’ work hours, to solve this you to do proper choosing the time clock software for your company.
The key to Collaborative BI is speed. Speed to a decision. Having better, more informed, fact-based conversations with the right people. As the Irish playwright G. Bernard Shaw famously commented:
”…if you have an idea and I have an idea and we exchange these ideas, then each of us will have two ideas.”
Or, at the very least, we have one, better, idea.
And, to finish with one final thought I recently received from my favorite BI Analyst, Howard Dresner:
”One piece of advice for Collaborative BI. Stop using email!”

How Social Business Solutions Power Collaborative Analytics
This article was originally published in Information Management (Sept 2016 edition)
 To a greater or lesser extent, everyone collaborates. I watch my two-year-old twins collaborate daily. I listen to the “collaborative creativity” within a jazz ensemble. Yet so often in a work context we operate in silos.
For decades, the silo of choice was the spreadsheet. Today, it’s becoming the data discovery “workbook.” Yet it’s no longer enough to just have meaningful analytics: it’s also about speed.
When Steve Jobs talked about his Macintosh development team at Apple, he talked about “…musicians and poets and artists…” He talked about “trying to expose yourselves to the best things that humans have done.” In other words, getting inspired by the ideas of others. Collaborating.
Consider how musicians collaborate: they predict, perceive, and react to what their fellow musicians do in complex ways. Collaboration is about listening to others and connecting to their emotions or intuitions. Collaborative Business Intelligence is about communicating a story with the data. Communicating the meaning behind the numbers. Business are constantly changing you can check here the most recent innovations for business. The numbers are the notes, in time and space. Harmony. Melody. Rhythm.
 So what is Collaborative Business Intelligence? According to Howard Dresner, it is “a process where two or more people or organizations work together to develop a common understanding, which is shared and used to build consensus in support of organizational decision making.” Collaborative capabilities include sharing, annotating and co-authoring of business content.
Recent research defines several distinct types or styles of collaboration, including:
- Distributed Collaboration – informal collaborations based on common interests
- Complimentary Collaboration – based on complimentary expertise, knowledge and/or roles
- Integrative Collaboration – collaborative development of a new concept or idea, which no individual could have conceived of on their own
The latter is commonly seen in the context of jazz improvisation, and often in the workplace where Agile principles have been adopted. Development of new ideas, through integrative collaboration, is a powerful way for an organization to foster a culture of Innovation.

People are the heart of business
It’s the same in a business context. People are at the heart of business. And Collaborative Analytics, or Collaborative Business Intelligence, is about putting the Business into Social.
Annual revenues for vendors in the Collaboration space are predicted to break $4.5 billion by 2016, and the Enterprise Collaboration Market is projected to be worth $70.61 Billion by 2019. That is significant growth.
In fact, recent research shows Social as the fastest growing segment of the Enterprise Collaboration market, with a projected CAGR over 18% – a trend which is projected to continue for several years. This is perhaps unsurprising considering how social and ‘tech savvy’ the workforce is becoming.
Consider how well-versed our teenagers, the next generation of knowledge workers, already are with social concepts, such as Facebook and WhatsApp. In recent product usability testing, we found that a 15-year-old high school student was able to immediately grasp collaborative BI concepts such as sharing and discussing dashboards via integrated chat, with little or no training.

Collaboration drives organisational alignment
As Howard Dresner commented, “Insight built collaboratively adds value faster and achieves faster consensus and better buy-in.” This in turn can help drive better organizational alignment to strategy and goals. It comes down to inspiring, motivating and empowering business users with a passion to help the organization drive better business outcomes for customers and shareholders.
Imagine the following scenario: members of a finance department are collaborating on a new budget. Having blended data from both internal systems as well as external data (for example, projected interest rates or customer demographic data), they seek feedback and collaboration from other managers in the business. They push a dashboard to an internal ‘community’ of managers on their Enterprise Social Platform, and engage in a dialog with those business users around market sentiment, budget assumptions and so on.
This information is captured in the Collaborative BI system, to provide an audit trail for subsequent decisions. Thus avoiding the perpetual issues with emailing static documents and spreadsheets with cell-reference and other common errors, making governance almost impossible.
So what does this mean for the future? What I expect to see is a trend towards solutions which help organisations get better at measuring outcomes, improving accountability in support of evidence-based decision-making. In recent years, the Business Intelligence market has strayed towards what Gartner Research sometimes refers to as the “wild, wild west” of siloed, ungoverned business data, causing “multiple version of the truth.”
An era of social business solutions powering a more collaborating analytical process would certainly be music to my ears.
As long as it’s jazz.

Lies, Damn Lies and Statistics…
I recently read an interesting article in the Sydney Morning Herald, entitled “Workaholics prefer Potts Point, but it’s go slow at the beach”. The very first paragraph by the author, (@MAttWadeSMH), makes the rather bold statement:
“The densely populated harbourside neighbourhood of Potts Point has emerged as Sydney’s hardest working suburb”.
This assertion was made on the basis of the recently released Australian Bureau of Statistics Census data for 2011.
Now, a very good friend, Richard Hoptroff, once made the comment: “If you torture the data long enough, it will tell you what you want to hear”. So I wonder if, in this particular case, the headline (a good one, admittedly) wrote itself and the Census data was then scoured for supporting evidence? Rather than, say, finding a way of letting the data tell it’s own story, free from what Bazerman would call “judgemental bias” (Bazerman, M.H. and Moore, D.A. (2008), Judgment in Managerial Decision Making, 7th ed. New York: Wiley.)
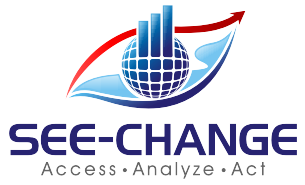
To support the story, several beach communities were used by way of contrast to “hard working” Potts Point(“..Pearl Beach workers only clocked up 29.4 hours”). So, I thought it would be interesting to put the data (freely available from http://abs.gov.au/census) into a Data Visualization tool (Tableau) and see what emerged..
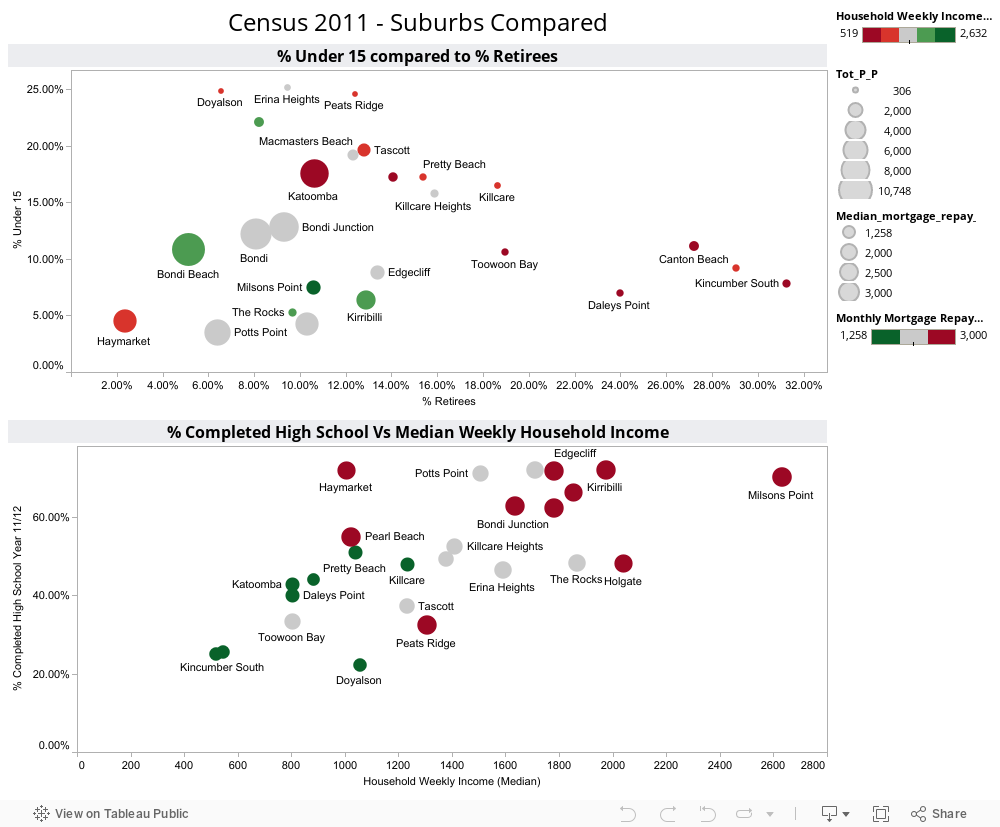
Immediately, it became obvious that large demographic differences were driving differences in median hours worked per week by suburb, not work ethic. For example, the communities called out for “only clocking up” less than 30 work hours per week, are made up of a significant proportion of retirees (Pearl Beach has 29% over 65, Kincumber South 31%, Potts Point only 6%. The median age in Kincumber South is 64, in Pearl Beach it is 62, in Potts Point, 35). So including those no longer working in a calculation of average working hours for a community is clearly flawed analysis (I’m sure those in the retirement communities of Kincumber South would argue they’ve worked hard enough for many years!!)
Similarly, Haymarket, another suburb called out in the “hall of shame” (ie in the Bottom 3 suburbs for average hours worked), has 31% aged between 15-24, with a median age of only 27. Now, with University of Technology Sydney and the University of Sydney within walking distance, I suspect this indicates these are university students (some may take offence to the notion that getting a degree is not “hard work”…).
Close to the “go slow” beach communities of Pearl Beach and Kincumber South, but at the other end of the spectrum in terms of demographic, are the communities of Erina Heights and Doyalson, both with 25% of their communities under 15 (compared to Potts Point which has 3% under 15). On the eve of National Teleworking Week, I wonder if we should instead be applauding those communities for striving for some level of work-life balance? (unless, of couse, @MAttWadeSMH has included children in his calculation of average hours worked..)
So, we can see that a suburb applauded for it’s work ethic, but with the majority of the population of working age, is very different to a suburb with most of the population over 65 or under 15. Visualizing the data helps us to see the real story behind the numbers.
Addendum:
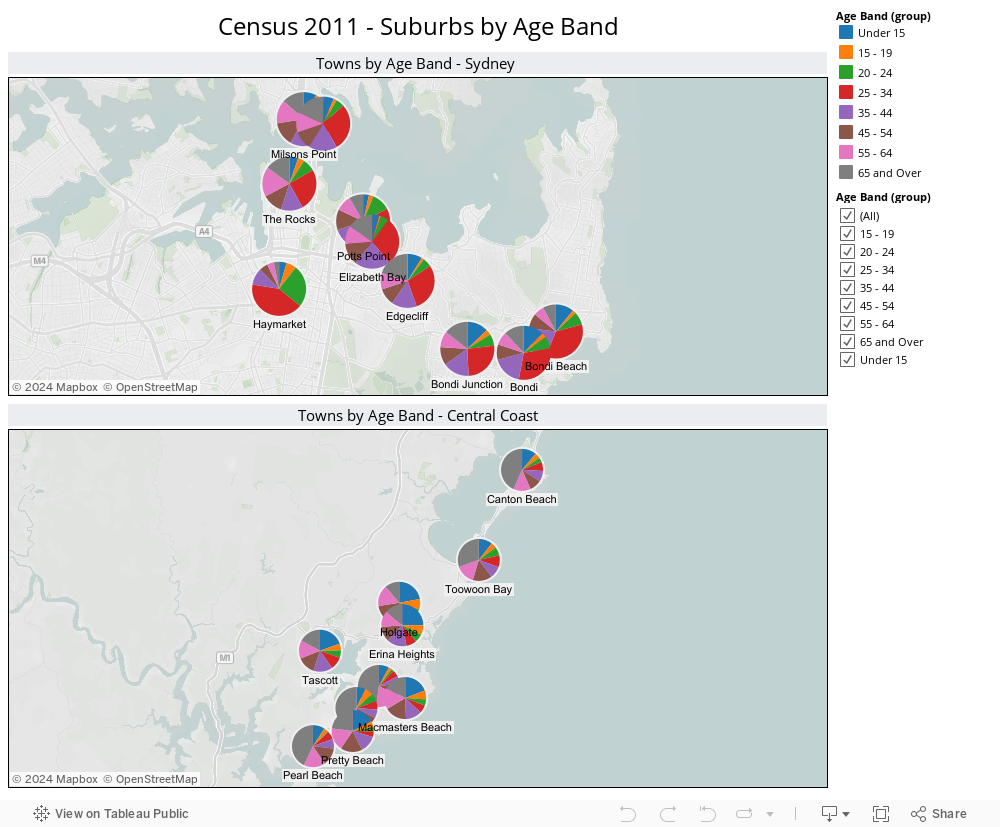
It’s not just the age demographic which is significantly different between the Central Coast and the likes of Potts Point, Milsons Point etc. Ethnicity by suburb also varies drastically, as shown by the following visualization:
")
Proactive decision making (and how to avoid running out of fuel)
 This weekend, I ran out of fuel on my way home from golf. I’d played a good, quick round, won the comp and was on my way home around 10.30am feeling pretty good. Then, unexpectedly, my car ran out of petrol. This got me to thinking about the difference between reactive and proactive decision-making …
Now typically, when fuel is getting low, I get a ‘warning’ light on the car dashboard. This is like your classic BI dashboard/scorecard – when something happens, the status may change from green to yellow or red. From this, I can then estimate that I need to refuel within some unknown but bounded number of kilometers, which I estimate based on past history to be somewhere between 25-40km (I do tend to ‘cut it a bit fine’ sometimes!). Similarly, in a business context, we watch for status indicators changing based on past history, then react based on experience, knowledge and ‘gut feel’, one of reasons why the traditional BI paradigm is sometimes referred to as being a “rear-view mirror”. This is reactive decision-making.
 However, this weekend, my fuel gauge was playing up, and didn’t indicate that I was low on fuel (it was still showing the tank as ¼ full). So, a few kilometers from leaving the golf course, I ground to a halt. If this was, by way of analogy, my ‘cash flow’ or similar financial indicator, I might be looking at a foreclosure or bankruptcy instead of the minor embarrassment of having to call the NRMA (Australian equivalent of AAA in the US or the AA in the UK) to be ‘rescued’.
At this stage, I still trusted my previously reliable indicator, the fuel gauge, so I had no idea of what could be causing the problem. Was it the alternator? Or worse? My NRMA patrolman (“management consultant”), in true Aussie larrikin fashion, bet me $20 that the problem was lack of fuel ie that my fuel gauge (financial ‘metric’) was misleading me. I took the bet. He won.
Ironically, my other vehicle has, instead of a fuel gauge, an onboard ‘algorithm’ which predicts, real-time, how many kilometers I can drive until the tank is empty. So if I’m burning rubber, it might drop to 8km to empty, if I’m driving on cruise control it might go up to 45km. This is proactive decision-making. I have a forward-looking view: if I do this, then this is the result. If it’s 40km to the nearest service station, I can adjust my driving accordingly in order to make it based on the fuel I have remaining. This is why moving beyond the traditional BI paradigm of reactive decision-making enables me to make better, more informed decisions. And avoid running out of fuel. Literally, or figuratively.
Connect
Connect with us on the following social media platforms.